TimeTrac Output - The printf Function

|
TimeTrac Event Examples |
This example is a basic hello_world program instrumented with TimeTrac event calls and is used to demonstrate the following basic functions:
Instrumentation Code -- Starting and Stopping TimeTrac |
Return to Top | ||
In order to initialize TimeTrac, we must create a file and set some initial TimeTrac
parameters. Refer to the
TimeTrac User Guide
for additional details.
For this example, we have the following code fragment to initialize the TimeTrac variables and
create a single TimeTrac
range event:
    TTHandle trace_log;
    TTEventHandle tt_hello_bgn, tt_hello_end;
    ......
    int tt_init ()
    {
      unsigned group_mask = 0xffffffff;
      unsigned group_id = 0x1;
      int use_thread_safe = 0;
      int num_events = 10000;
      int context_depth = 1;
      int status;
      char filename[256];

      /* Create the trace file name */
      sprintf (filename, "hello_world");

      /* Create all neccessary TimeTrac handles */
      status = time_trac_open (filename, use_thread_safe, num_events, group_mask,
                               TT_NO_AUTO_SAVE, TT_CREATE_FILE, context_depth, &trace_log);
      VERIFY_TIMETRAC_STATUS (status);

      /* This example has a single TimeTrac range event. */
      status = time_trac_reg_range_event (trace_log, "print_hello", "Blue",
                                          group_id, &tt_hello_bgn, &tt_hello_end);
      VERIFY_TIMETRAC_STATUS (status);
    }
Similar to the time_trac_open call above, we have two function calls to
save the data and to close the file. The code below first saves the TimeTrac
data to file; the 2nd line of TimeTrac code closes that file:
    int tt_term ()
    {
      int status;

      /* Save the events by overwritting any existing file, close the TimeTrac file. */
      status = time_trac_save (trace_log, TT_OVERWRITE_FILE);
      VERIFY_TIMETRAC_STATUS (status);
      status = time_trac_close (trace_log);
      VERIFY_TIMETRAC_STATUS (status);
    }
From this we can see that the creation of the TimeTrac data file and of TimeTrac events
is very easy; the saving of data and closing of the TimeTrac file is also very easy.
|
|||
Instrumenting the Code -- Logging Events |
Return to Top | ||
|
For the range event described above, we must log beginning and end data that bracket the range of interest. In this example, we will time the printf function call:
  /* Time, via TimeTrac, the printed message */
  for (i = 0; i < 10; i++)
    {
      /* Time the call to a system function. */
      time_trac_record (trace_log, tt_hello_bgn, (float)i);
      printf ("Hello World -- %d\n", i);
      time_trac_record (trace_log, tt_hello_end, (float)i);

      /* Spread out the above times when viewed w/ TimeTrac. */
      ex_spin_some (500);
    }
We now have a loop instrumented with TimeTrac calls to measure the time it takes
to make a printf system call, ten times. In this code fragment,
there is also a function call that wastes
time; this is here to separate the printf calls when displayed, below.
|
|||
TimeTrac Output - The printf Function |
Return to Top | ||
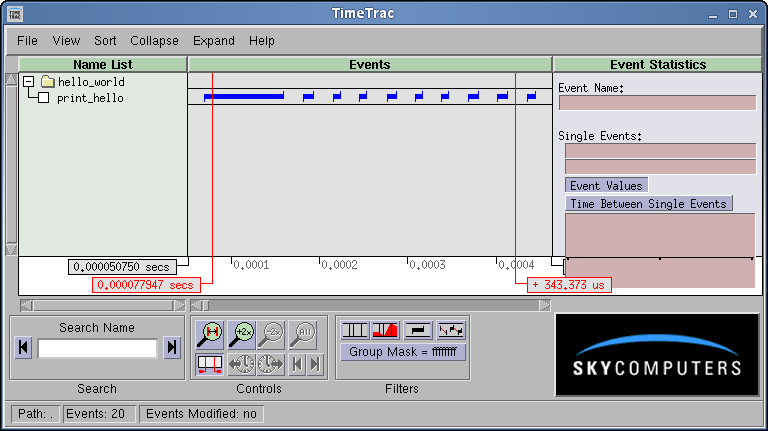
| If we compile and run this example, it will create a trace file named hello_world.trc in the same directory that we ran the code. If we then start TimeTrac in the same directory as the trace file, we will see a display similar to the following (the displays here have been shrunk for the purpose of demonstration, and the times displayed will be different on different platforms): | |||

|
|||
| From this screen, we can readily see that the printf function was called a total of ten times and that the time to execute this function varied significantly. | |||
TimeTrac Output -- Event Details via Pop-up Window |
Return to Top | ||
| To get more details about a particular range event, hold the cursor over the event of interest (for example, over the 3rd range event). Then hold the shift key down and left click; we will get a pop-up window similar to the following that displays parameters about this particular event. | |||

|
|||
| The two middle rows display information about the event that we are pointing at. The first row lists parameters for the previous end (stop) event; the last row lists parameters for the next start event. The Firing column lists the number of times (1 based) that this event has occurred. The Value field is a floating point value that the application program elected to log. Here it is a zero based count of the number of times that this event has occurred. (It is redundant to do this, Firing and Value differ by one in this program, but this is for demonstration purposes only.) The Elapsed Time is the time from Event Start to Event Stop. | |||
| If, however, we do the same thing between two range events, we get the following. Now we have two range events display; the top one corresponds to the event to the left of the cursor, the bottom event matches that to the right of the cursor. | |||

|
|||
TimeTrac Output -- Histogram |
Return to Top | ||
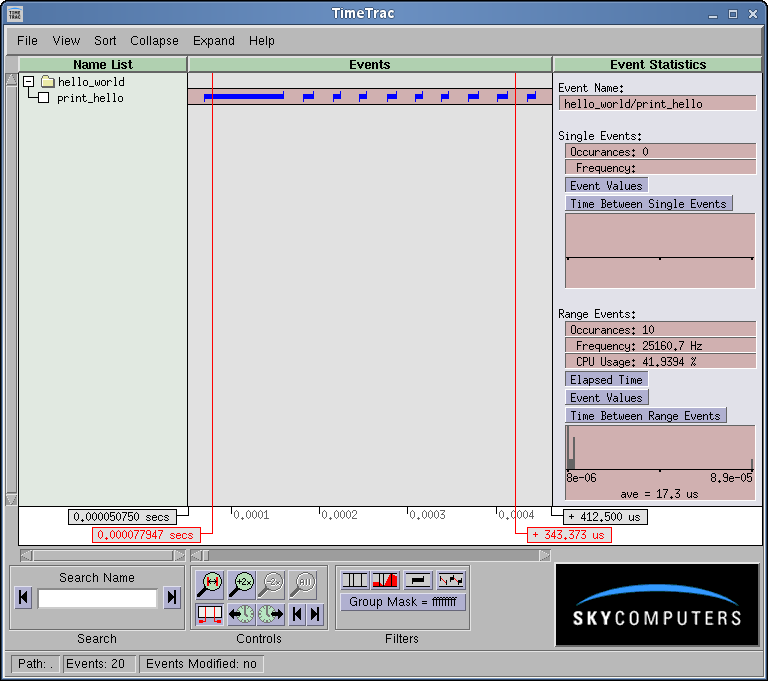
| If we click (and release) anywhere on the line of this particular event (in the Events Box, opposite the print_hello label), we will see that the window labeled Range Events will now show us statistics about this set of events. You must have enough of the screen visible, as below, to see the Event Statistics/Range Events portion of the box. | |||

|
|||
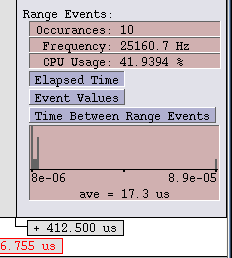
| Focusing on the Event Statistics/Range Events box, | |||

|
|||
|
This facility gives a quick measure of the minimum, maximum, average times and a general distribution
for a given range of events. This makes it very easy to see the performance impact of, for example,
making algorithm changes. Note that
these values are only valid for the range displayed on the screen; if we move the
time bars
and display a different set of events, we will see the statistics for just those events.
|
|||
Source Code |
Return to Top |
| Module | TimeTrac Functions |
|---|---|
| hello_world.c | All calls -- TimeTrac User Guide |
| sky_ex_inc.h | See time_trac.h |
Hello World Summary |
Return to Top | ||
This first example consists of hello_world in a loop of 10 and is used to
demonstrate the following:
|
|||
| Previous | Return Intro | Return to Top | Next |