TimeTrac Output - Single Thread, Multiple Events
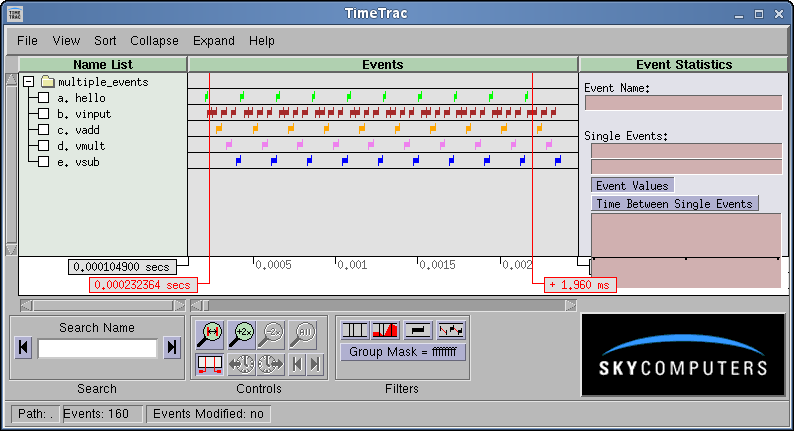
If we run this program it will create a file named multiple_events.trc. If we then run TimeTrac, do a "Sort/By Increasing Name," we will see a display similar to the following.

|
TimeTrac Event Examples |
This example is a expansion of the previous example that adds some math operations and additional TimeTrac instrumentation to time those functions. The example covers the following basic functions:
TimeTrac Output - Single Thread, Multiple Events |
Return to Top | ||
|
If we run this program it will create a file named multiple_events.trc. If we then run TimeTrac, do a "Sort/By Increasing Name," we will see a display similar to the following. |
|||

|
|||
| We now have a visual presentation of 5 different events within a single thread. From the TimeTrac display, it is easy to see the sequence of function calls relative to each other and approximately how long each one took. | |||
TimeTrac Output -- Measuring Time Between Events |
Return to Top | ||
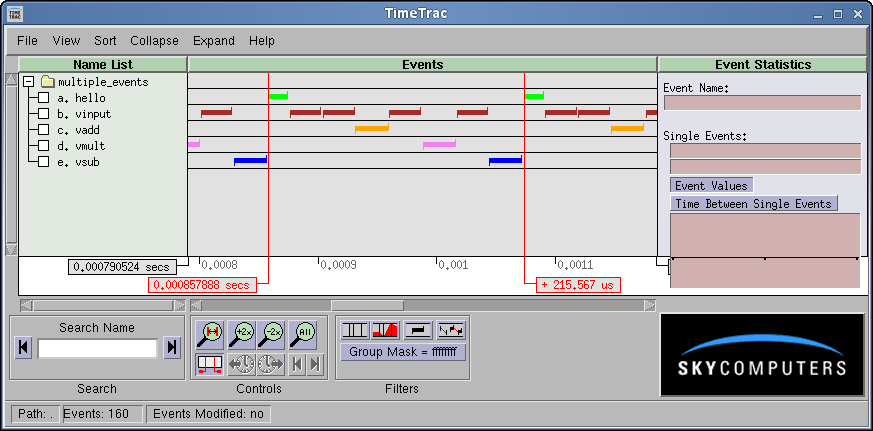
| If however, we want to see more detail, we can drag the time bars such that the left time bar (hold left mouse button and move the mouse) is near the beginning of the third hello event, and the second time bar is near the beginning of the 4th hello event (set the pointer at the edge of the event and right click the mouse). Now to expand the screen, click on the icon for the time bars. We can now read directly the length (adjust the time bars if necessary) of time from one event to another, in this case the sequence from one hello to the next hello. | |||

|
|||
| In this case, the total time for this series of events took approximately 215 microseconds. In a similar manner, we can use the controls to further shrink or expand the screen and to easily measure the time between any 2 events. | |||
TimeTrac Output -- Measuring CPU Usage |
Return to Top | ||
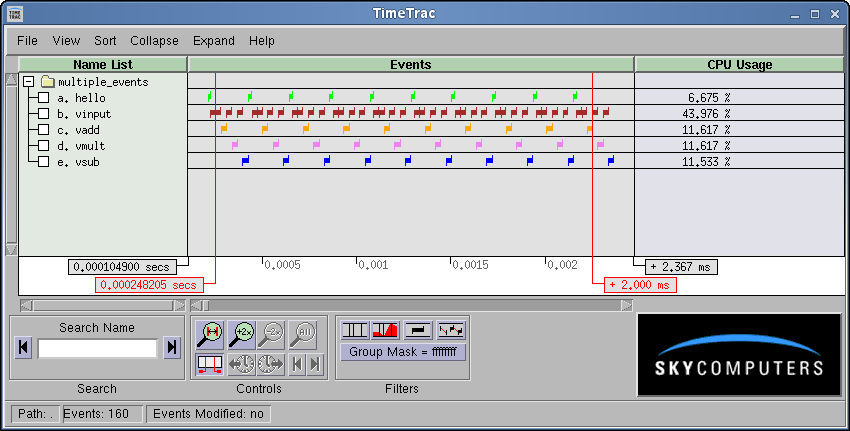
| To view the CPU usage for each event, zoom out all the way and then click on View/CPU Usage in the Menu Bar: | |||

|
|||
| Now observe that on the right side of the TimeTrac display, we have the amount of CPU Usage for each of the events and can quickly determine where we might best spend our algorithm efforts to make the application run faster. For example, speeding up "vinput" would provide a real benefit (it is currently using 44% of a cpu) but speeding up "hello" (at 6.7% of a CPU) would not help us very much. | |||
Source Code |
Return to Top |
| Module | TimeTrac Functions |
|---|---|
| multiple_events.c | All calls -- TimeTrac User Guide |
| ex_math.c | No TimeTrac calls |
| ex_misc.c | No TimeTrac calls |
| sky_ex_inc.h | See time_trac.h |
Multiple Events Summary |
Return to Top | ||
|
This example shows additional TimeTrac outputs for a single thread.
|
|||
| Previous | Return Intro | Return to Top | Next |