SKY Logo TimeTrac Event Examples

TimeTrac Home

Example 6 -- Locks

This example also uses a main thread to start the other threads that consist of a group of compute threads, and a output thread (vsum) to simulate a small application. In this example, synchronizing these threads is done via lock code that have been instrumented with TimeTrac. There is no I/O involved here; the vinput generates an input internally, vsum is assumed to be the output but we have added the requirement that vsum can not execute until the other threads have completed processing the corresponding data blocks. We have done this in a manner that provides some level of load balancing:


Here we started the application and let it run for a few seconds until it terminates. Termination is caused by the watchdog thread (actually the same thread that started the other threads) when it notices that the application is not progressing. With different threads taking locks at different times, it can be very difficult to determine where the problem occurred.

We cover the following basic TimeTrac functions:
  1. TimeTrac Output -- Big Picture.

  2. TimeTrac Output -- Tail End of TimeTrac Output.

  3. TimeTrac Output -- Anomalies.

  4. Locks Summary


TimeTrac Output - Big Picture

Return to Top

If we run this program until it terminates, it will create several TimeTrac trace files with the .trc extension. If we then run TimeTrac to view these files, we will see a display similar to the following below. In this case we have a main thread with three events instrumented, multiple threads each with multiple events instrumented, and an output thread (vsum) with a two events instrumented. The vsum thread must wait for the completion of the Compute threads before starting. In this example, locks are used to manage that synchronization.

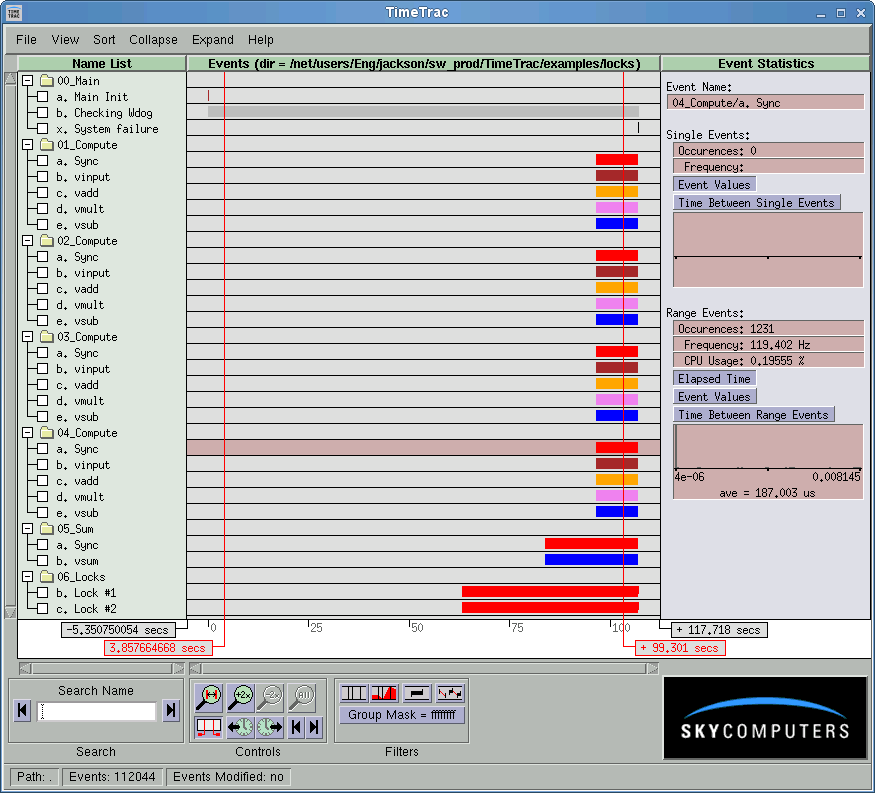
In this example, we have been running for some time and the application was terminated by the watchdog thread. The TimeTrac output as the viewer is first started appears as:
TimeTrac Screenshot

Note that only the Main trace displays events from the beginning of the application start through the timeout. This is because the threads are capturing data in circular buffers that when full, will wrap back to the buffer beginning. Thus only the last few events are captured and need to be inspected (the maximum number of events saved is determined by the time_trac_open call).


TimeTrac Output -- Tail End of TimeTrac Output

Return to Top

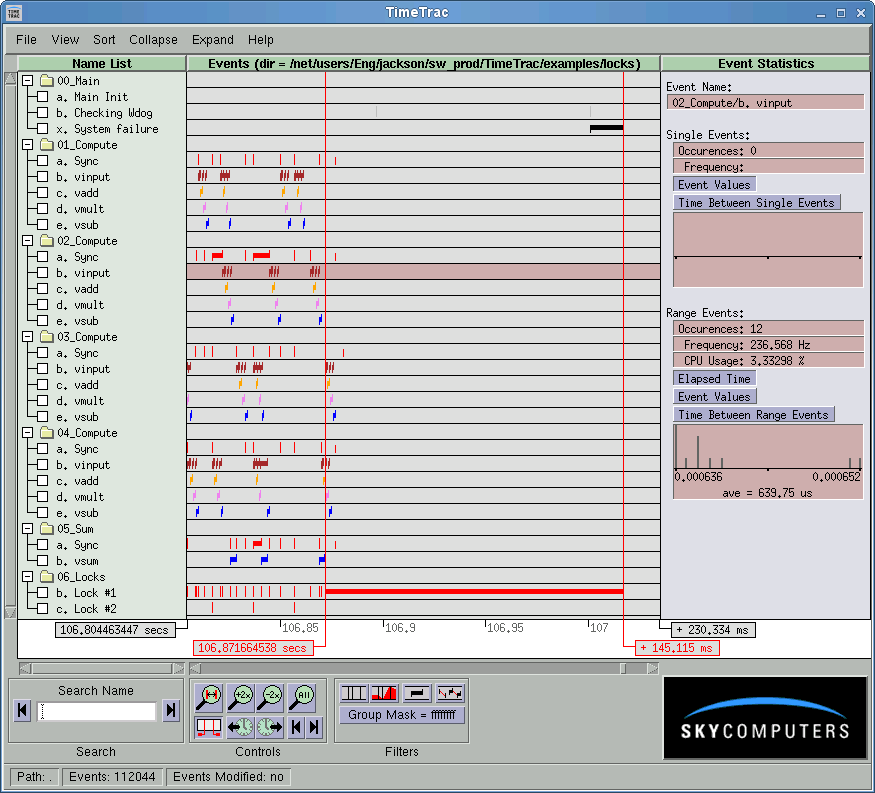
If we expand the end of the TimeTrac trace, we notice that after approximately 107 seconds, the watchdog trace (00_Main, top of screen) has detected a failure. That failure is due to one of the locks being held for a long time (it was held until the watchdog thread forced a lock release).

Deadlock eaxample

By inspecting Lock #1 (hold down the shift key and left click with the mouse on that range event: we have some more information about what caused the failure. The value logged during the time of the start of the held lock is "3", and the value at the end is "0".

Lock example

Inspecting the lock code that logs the start of this event (the lock has a wrapper written around it), we have:

    int get_sync (int rank, int data_cnt)
    {
      int  i;
      int  index;
      int  ret = LK_TH_GO;
      . . . .
      time_trac_record (Trace_Log[rank], tt_sync_bgn[rank], rank);  

and we observe that the logged value is the rank of the thread that took the lock. Thus we know that Thread #3 took the lock and failed to release it. In a similar manner, the wathchdog thread released the lock (Thread #0). Looking at the code for Thread #3 (module lk_compute.c), we notice ....

   /* Bug -- At pass 5555, grab the lock and keep it. */
   if ((tcb->Pass == 5555) && (tcb->Rank == 3))
     {
       take_lock (tcb->Rank, 1);
     } 

In this example, it was especially easy to spot the bad code. In real world cases it might not be so easy but with the TimeTrac display, we can quickly determine where we should be looking. This example indicated that thread of rank 3 was holding the lock; inspecting other events in the area of failure, indicated that the hang occured in the area of data block #5555; another piece of useful information.


TimeTrac Output -- Anomalies

Return to Top

It is often very useful to use the TimeTrac viewer to verify that the application is running as expected; sometimes the code runs but not the way we expected, as in the following.

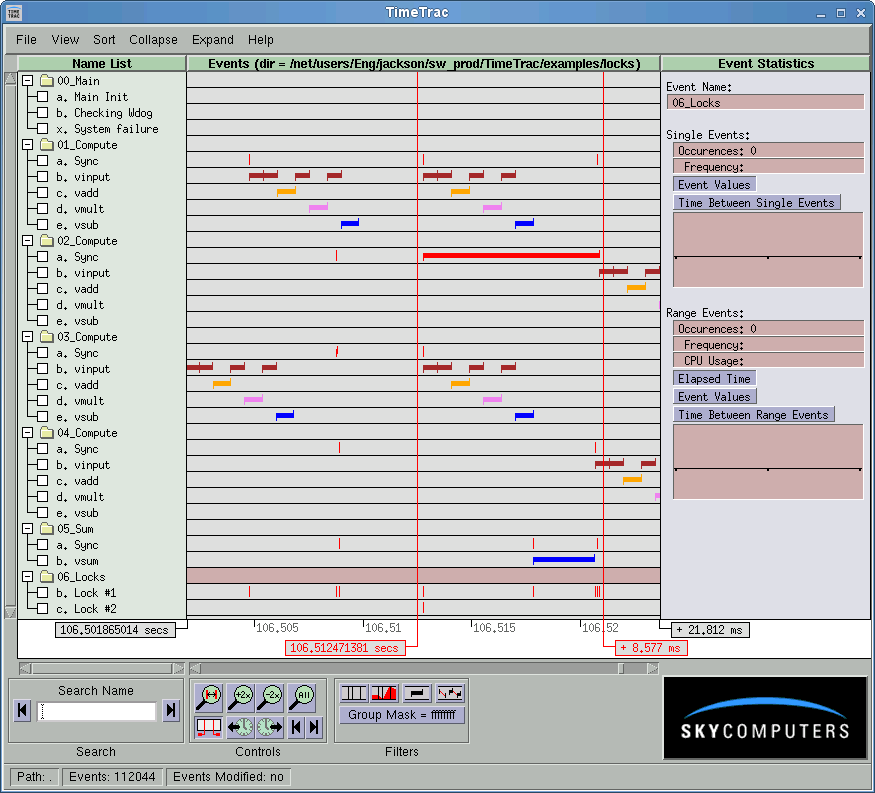
If we expand the TimeTrac trace in the area of approximately 106.5 seconds, we notice that occasionally one of the threads is in the lock code for a much longer time than expected. Here, Thread #2 has called the lock code and is stuck in that code for several milliseconds. Everything else appears to be running; other threads are executing and so does Thread #2 after some time delay.

lock screenshot


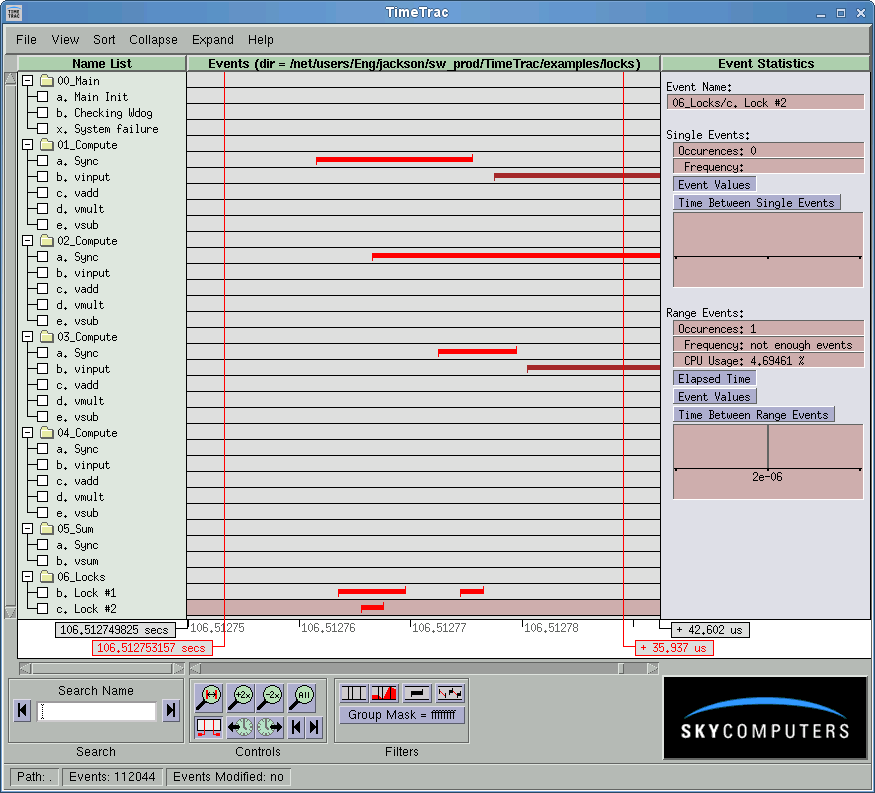
By expanding the scale at the beginning of the Sync trace (below), we can clearly see that Thread #2 is in the Sync code but does not have either of the locks. And it stays in the Sync code for some time. On further inspection, we have;

TimeTrac Screenshot

Left most range event infomation for Lock #1, above:
(Thread #1 holds the lock)

TimeTrac Screenshot

Right most range event infomation for Lock #1, above:
(Thread #3 holds the lock)

TimeTrac Screenshot

Thread #2 tried to acquire the lock but failed because Thread #1 already had the lock. It then lost its turn when Thread #3 jumped in and grabed the lock (most likely due to system scheduling). Now both processors are busy (in this particular system there was only two) and Thread #2 can not proceed until one of the others finishes.


Source Code

Return to Top


Module TimeTrac Functions
lk_main.c All calls -- TimeTrac User Guide
lk_compute.c All calls -- TimeTrac User Guide
lk_sum.c All calls -- TimeTrac User Guide
lk_lock.c All calls -- TimeTrac User Guide
ex_alloc.c No TimeTrac calls
ex_math.c No TimeTrac calls
ex_misc.c No TimeTrac calls
sky_ex_inc.h See time_trac.h
lk_tcb.h No TimeTrac calls


Locks Summary

Return to Top

This example involves the use of locks (using the pthread_mutex_lock)

  • With a failing lock ("deadlock" condition), we can readily see which thread caused the deadlock.
  • We can also inspect the TimeTrac display for unexpected behavior that may or may not affect application execution, in this case a non-fatal "livelock" condition.


Previous Return Intro TimeTrac Home Return to Top Next