TimeTrac Output -- Failed Relationships

|
TimeTrac Event Examples |
Again we use the same model where the main thread is used to
start and control the other threads.
The other threads consists of a group of compute threads, and a
output thread (vsum).
We have modified the event names such that the last event in the compute threads is
causal
to the first event in the output (vsum) thread.
Here we started the application and let it run to completion. When we inspect the output from
TimeTrac, it is not as expected. We need to know where it went wrong and what happened.
We have the following basic TimeTrac outputs:
TimeTrac Output -- Failed Relationships |
Return to Top | ||
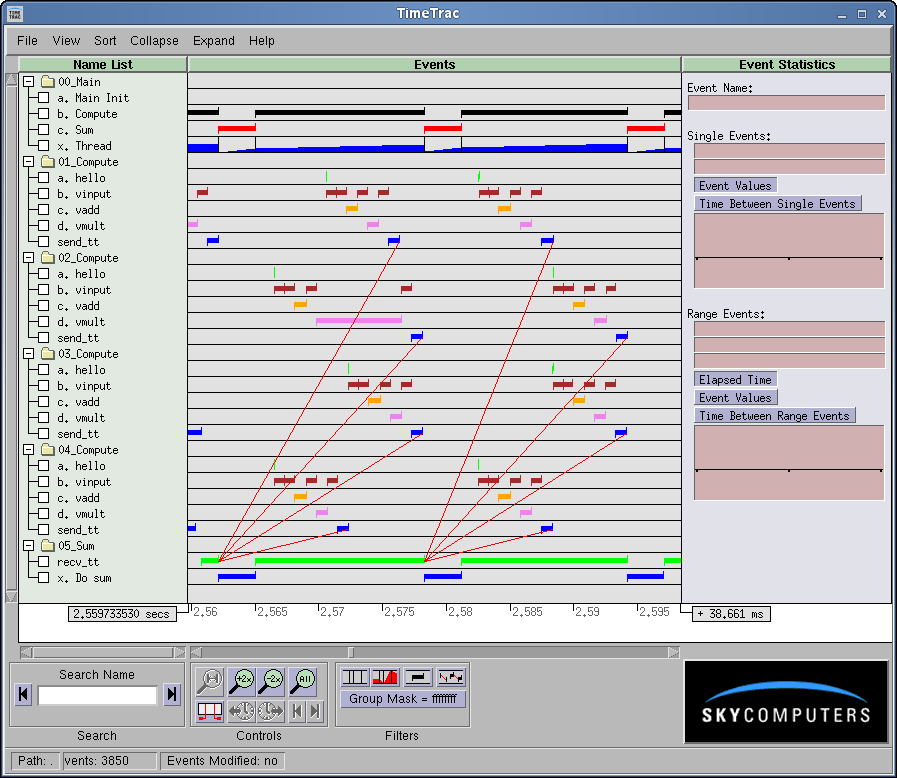
| When we run this program it will create several files with the .trc. extension. Running TimeTrac and expanding the scale in the 2.58 second range for example, we see a display similar to the following below. In this case we expected the output (05_Sum/recv_tt) to collect input from the 4 compute threads (send_tt). However, the 05_Sum/recv_tt believes that it has received its data before it has been sent, likely producing wrong results. Starting TimeTrac and expanding the time bars, we have: | |||

|
|||
| We need to know if we started correctly or not. | |||
TimeTrac Output - Expected Relationships |
Return to Top | ||
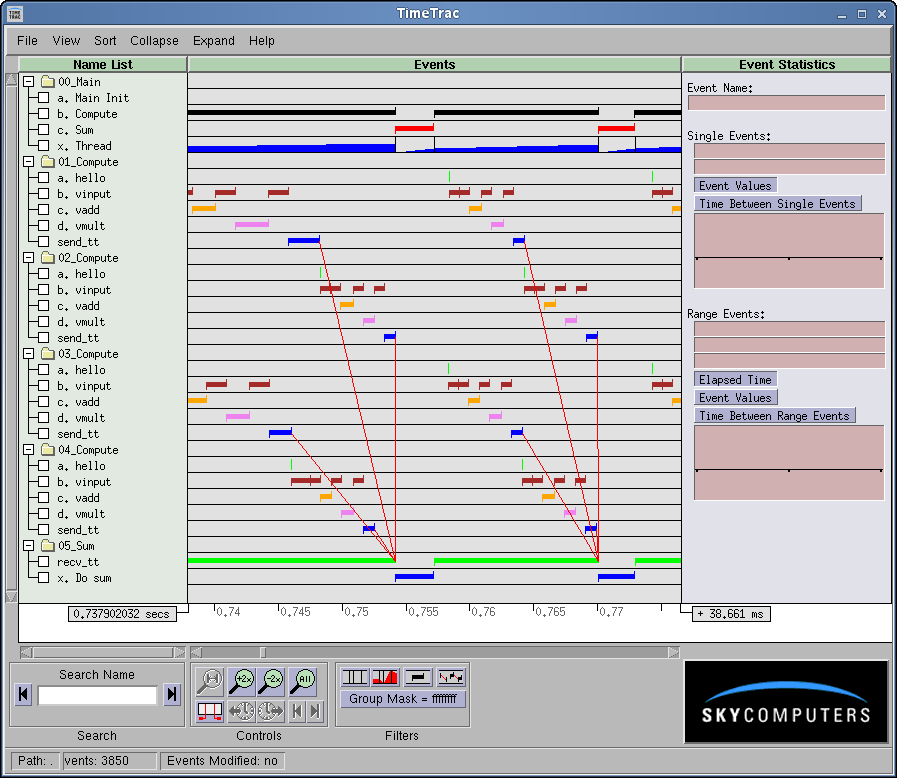
| If we look further back in time (for example near 0.76 seconds) we see a correct output. The compute threads generate their output (send_tt), then the 05_Vsum stage uses that as its input (recv_tt.) | |||

|
|||
| Checking additional points in this area produces similar results so it appears that the application started correctly. | |||
TimeTrac Output -- Point of Failure |
Return to Top | ||
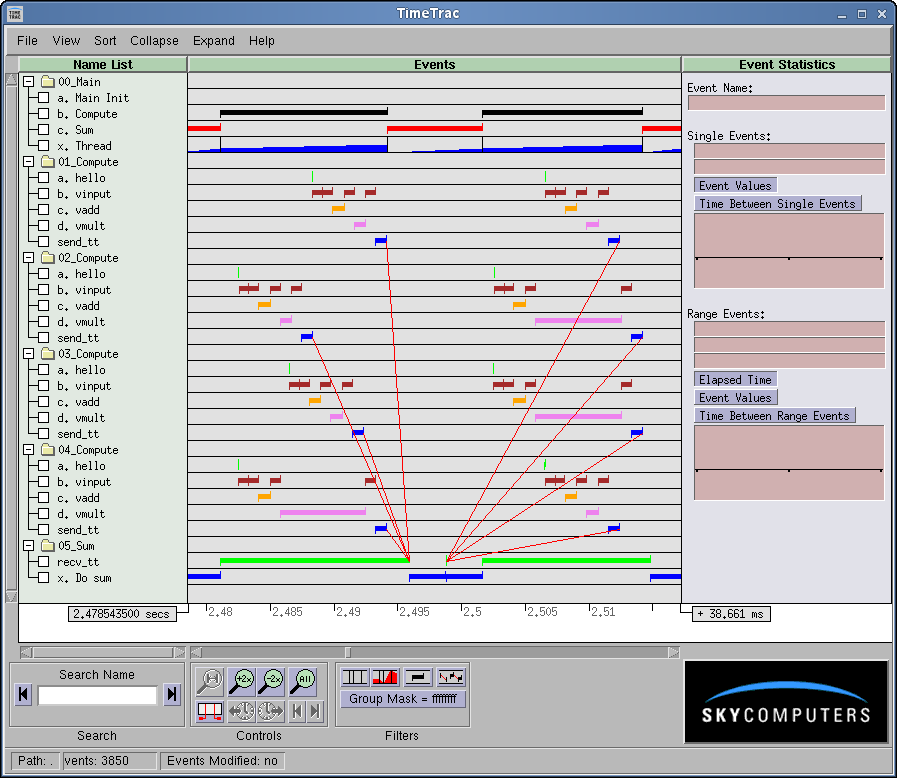
| Searching between the good and the bad points until we find the point when the TimeTrac output changes from one display to another gives us: | |||

|
|||
|
Here it appears that the Vsum/Do Sum module executed twice in quick succession.
After that, the module was out of sync with with the rest of the application
producing incorrect results.
Futher examination will reveal that the failure occurred at the 123 event firing. Examination of the code for the main thread indicates a failure in this area. |
|||

|
|||
Source Code |
Return to Top |
| Module | TimeTrac Functions |
|---|---|
| re_main.c | All calls -- TimeTrac User Guide |
| re_compute.c | All calls -- TimeTrac User Guide |
| re_sum.c | All calls -- TimeTrac User Guide |
| ex_alloc.c | No TimeTrac calls |
| ex_math.c | No TimeTrac calls |
| ex_misc.c | No TimeTrac calls |
| sky_ex_inc.h | See time_trac.h |
| re_tcb.h | No TimeTrac calls |
Relationships Summary |
Return to Top | ||
|
This example shows how Timetrac can show relationships between events.
|
|||
| Previous | Return Intro | Return to Top | Next |