TimeTrac Output - Initial Screen, Multiple Threads with Multiple Events
| TimeTrac Event Examples |
This example uses a main thread to start the other threads, a group of compute threads, and a output thread (vsum) to simulate an application. There is no I/O involved here; the vinput generates an input internally, vsum is assumed to be the output. In the example, we cover the following TimeTrac functions:
TimeTrac Output - Initial Screen, Multiple Threads with Multiple Events | Return to Top | ||
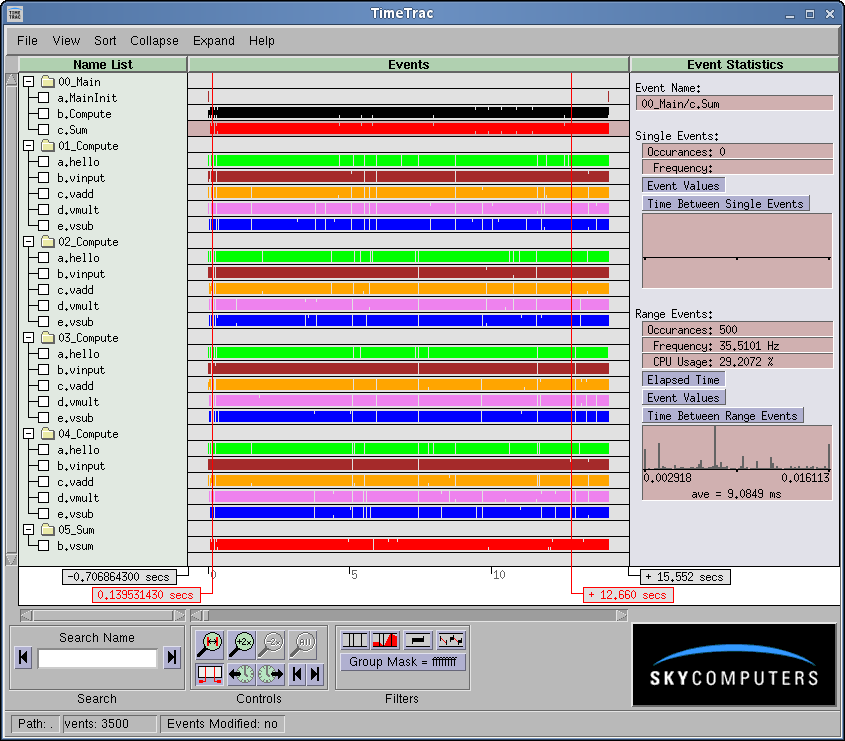
| If we run this program, it will create several files with the .trc. extension. If we then run TimeTrac in that same directory, we will see a display similar to that below. In this case we have a main thread, multiple compute threads and an output thread (vsum) each with multiple events instrumented, The vsum thread must wait for the completion of the Compute threads before starting. In this example, the main thread manages that synchronization. | |||
 | |||
| By clicking on "00_main/b.Compute" we get 19.1 microseconds (in the Range Event box). Then clicking on "00_main/c.Sum," we get 9.1 microseconds (in the Range Event box). These times are greater than what we expected and we should look further. | |||
TimeTrac Output -- Delayed Operation, Linux Scheduling | Return to Top | ||
| If, for example, we expand the area around the 6 second mark, we notice that there is considerable "dead time" between the 05_Sum/vsum end and the beginning of the next compute cycle (00_Main/b.Compute). | |||
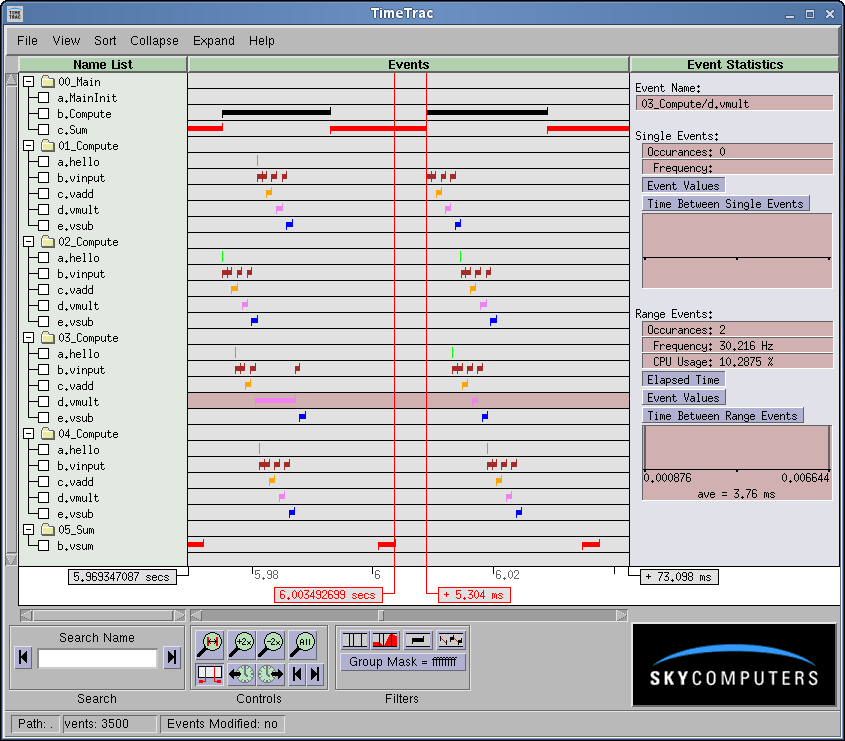 | |||
| In a similar manner, there is additional "dead time" between the last compute operation and the beginning of the next summation cycle, 05_Sum/vsum begin (see below). | |||
 | |||
Timetrac Output -- Improved Scheduling | Return to Top | ||
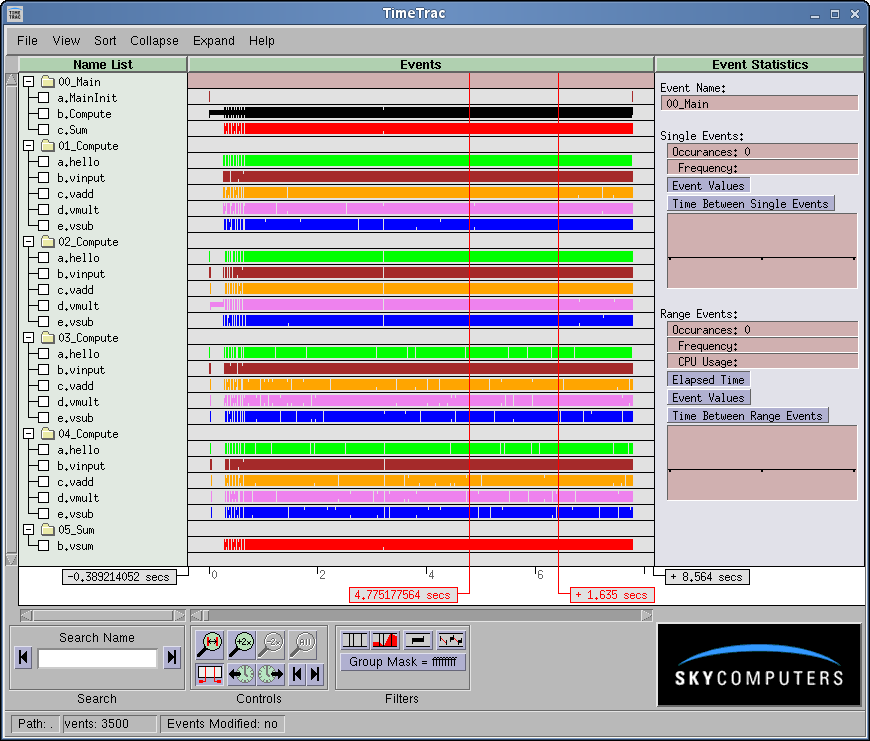
By inspecting the source code, we notice that we have usleep function calls in the general area of these dead times. We change these to sched_yield calls (see the Makefile, turn on -DBETTER), as follows #ifdef BETTERthen recompile and rerun the application. We then get 12.6 microseconds (in the Range Event box for "00_main/b.Compute") and 3.0 microseconds (in the Range Event box for "00_main/c.Sum"). These times are much better than before. | |||
 | |||
| Expanding up the region around the 6 second mark for a closer inspection, | |||
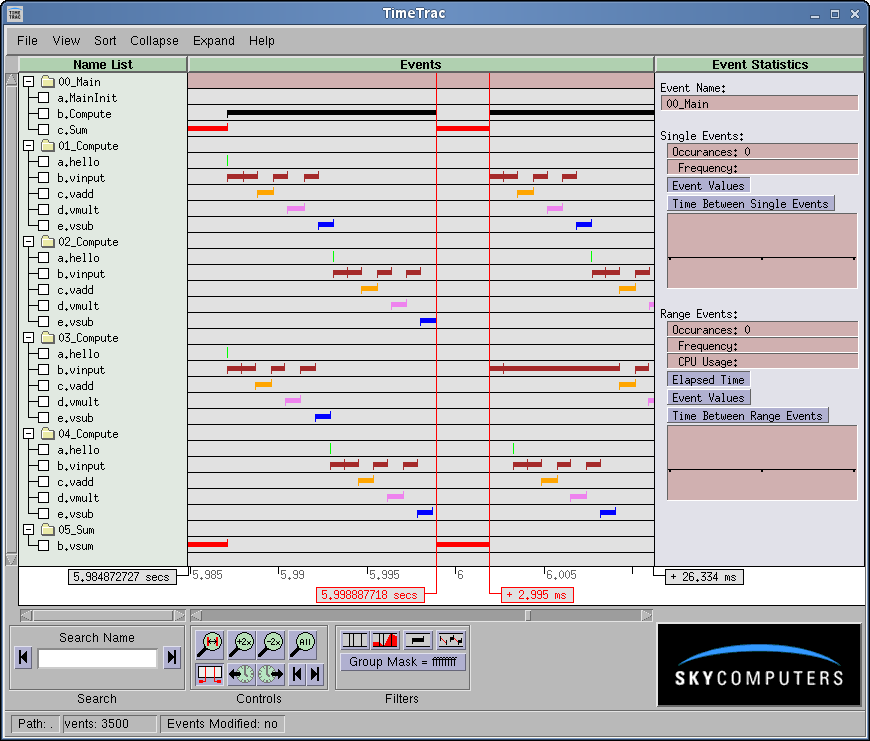 | |||
| we notice that the "dead times" are now gone. The usleep system call was needlessly consuming cycles and causing the observed dead time. Had we not observed this above, we would not have realized that we could easily easily boost the applications performance. | |||
Source Code | Return to Top |
| Module | TimeTrac Functions |
|---|---|
| in_main.c | All calls -- TimeTrac User Guide |
| in_compute.c | All calls -- TimeTrac User Guide |
| in_sum.c | All calls -- TimeTrac User Guide |
| ex_alloc.c | No TimeTrac calls |
| ex_math.c | No TimeTrac calls |
| ex_misc.c | No TimeTrac calls |
| sky_ex_inc.h | See time_trac.h |
| in_tcb.h | No TimeTrac calls |
Interactions Summary | Return to Top | ||
| In this application with multiple threads interacting with each other, TimeTrac visually demonstrates:
| |||
| Previous | Return Intro | Return to Top | Next |